
In the next 30 years Metro Vancouver is projected to grow by about 1.1 million people.[1] To understand the impact of this growth we will use the West End as an illustration. Pictured below, the West End is a residential area primarily consisting of mid-rise and high-rise apartment buildings. Before the 6-story building cap was lifted in 1957 the West End mostly consisted of detached housing.[2]
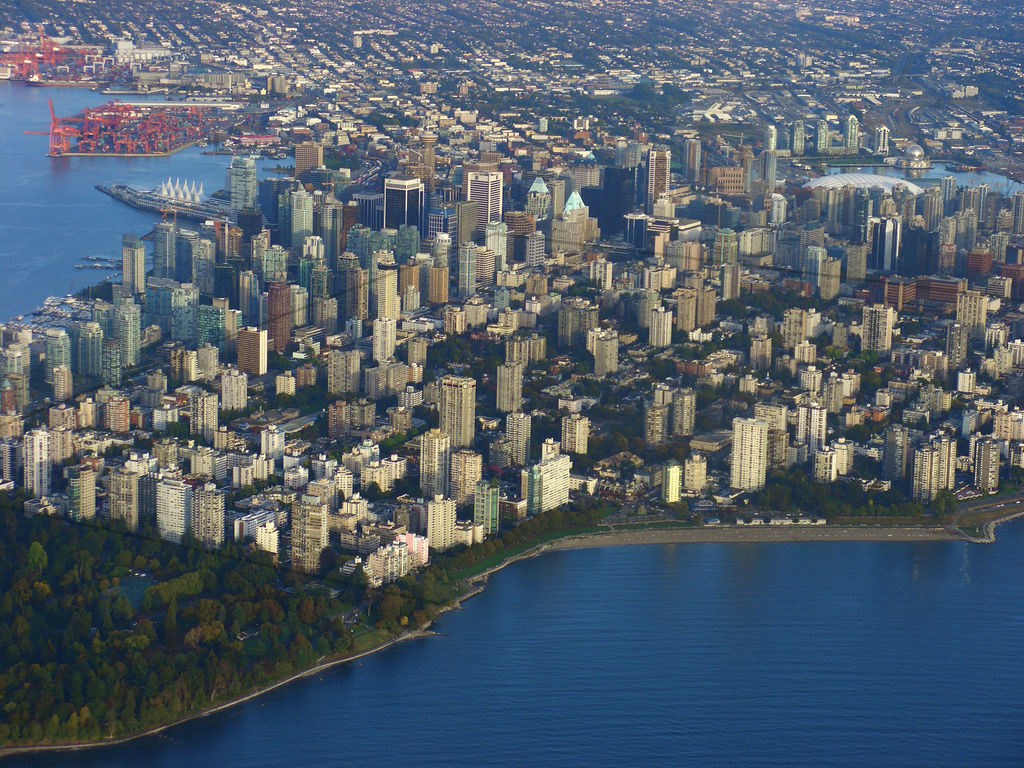
Note: Outline showing boundary of West End Neighborhood
Using the population growth projections for Metro Vancouver, we can determine the size of the neighborhoods that would need to transition from single family residential to West End equivalent densities in order to accommodate this growth.
| SUBREGION | POP. 2011 | POP. 2041 | +POP. 2011 – 2041 | +%POP. 2011 – 2041 |
| 1. North Shore[3] | 176,600 | 244,000 | 67,400 | 38% |
| 2.Vancouver, UBC[4] | 616,500 | 770,000 | 153,500 | 25% |
| 3. Burnaby, New Westminster | 289,200 | 447,000 | 157,800 | 55% |
| 4. Tri-Cities[5] | 218,500 | 364,400 | 145,900 | 67% |
| 5. Maple Ridge, Pitt Meadows | 93,800 | 156,000 | 62,200 | 66% |
| 6. Richmond | 198,600 | 283,500 | 84,900 | 43% |
| 7. Surrey, White Rock, Delta | 587,500 | 890,000 | 279,400 | 48% |
| 8. Langley[6] | 129,300 | 249,000 | 119,700 | 93% |
| METRO VANCOUVER TOTAL | 2,310,000 | 3,400,000 | 1,090,000 | 47% |
For the baseline density in this calculation we will use Hastings-Sunrise, a neighborhood in Vancouver that primarily consists of detached housing. Using the difference in population density between Hastings-Sunrise and the West End we can determine the size of the densified residential areas required to accommodate the population growth.
West end population density: 21,830 / km2 [7]
Hastings-Sunrise population density: 4,190 / km2 [7]
The results are calculated in Table 2 below. To give a sense of proportion the results are compared to the 2.0 km2 [8] area of the West End and the 5.8 km2 [9] area of the downtown Vancouver peninsula from Main Street to Stanley park.
| SUBREGION | DENSIFIED AREA (km2) | TIMES SIZE OF WEST END | TIMES SIZE OF DOWNTOWN PENINSULA |
| 1. North Shore[3] | 3.8[10] | 1.9 | 0.7 |
| 2.Vancouver, UBC[4] | 8.7 | 4.3 | 1.5 |
| 3. Burnaby, New Westminster | 8.9 | 4.4 | 1.5 |
| 4. Tri-Cities[5] | 8.3 | 4.1 | 1.4 |
| 5. Maple Ridge, Pitt Meadows | 3.5 | 1.7 | 0.6 |
| 6. Richmond | 4.8 | 2.4 | 0.8 |
| 7. Surrey, White Rock, Delta | 15.8 | 7.8 | 2.7 |
| 8. Langley[6] | 8.7 | 4.3 | 1.2 |
| METRO VANCOUVER TOTAL | 61.8 | 30.3 | 10.7 |
The image below shows the size of the densified areas required in the sub-regions of Metro Vancouver. The locations selected are primarily single family detached residential, but are otherwise arbitrary. The areas are intended only to give a sense of the scale of residential redevelopment that will need to occur.

Note: West end shown in green. Scale of densified residential areas required to accommodate the population growth are shown in red. These areas only represent residential growth and do not take into account the additional space required for other uses (ie. commercial, office).
NOTES AND REFERENCES
1. Greater Vancouver Regional District Board (2013). Metro Vancouver 2040: Shaping Our Future. p. 68.
2. City of Vancouver 2012 (2012). West End Community Profile 2012. p. 7.
3. Includes City and District of North Vancouver, West Vancouver, and Lions Bay
4. Also includes remainder of Electoral Area A
5. Includes Coquitlam, Port Coquitlam, Port Moody, Anmore, and Belcarra
6. Includes Langley City and Township
7. Eyeonnorquay (2013). Vancouver’s 22 Local Areas Over Time.
8. http://en.wikipedia.org/wiki/West_End,_Vancouver
9. http://en.wikipedia.org/wiki/Downtown_Vancouver
10. 67,400 / (21,830 – 4,190) = 3.8

Pingback: Matt Taylor: The New West Ends | Price Tags
How anyone can be ok with a global sustainable development plan authored by and partnered with some of the world’s most evil corporations, I’ll never know. I suppose Monsanto is the population reduction component of that plan. And they certainly don’t mention the massive hit your freedom will take. Brave New world isn’t an equal New world, that is certain. Listen, if these people cared about the planet more than they cared about controlling populations, you would think they would start with the corporations, the single entities unabashedly raping the earth.