
Over the next 10 years Metro Vancouver’s population is expected to increase by 360,000.[1] This analysis examines the impacts and transportation costs associated with this growth. It will consider two different development patterns. The low density pattern has a residential density you would find in a moderate density suburb. The high density pattern has a density equivalent to that of the West End neighborhood in downtown Vancouver.
| LOW DENSITY | HIGH DENSITY | |
| Density (people/km2) | 3,000 | 22,000 |
| Undeveloped Area Required | 120 km2 | 16 km2 |
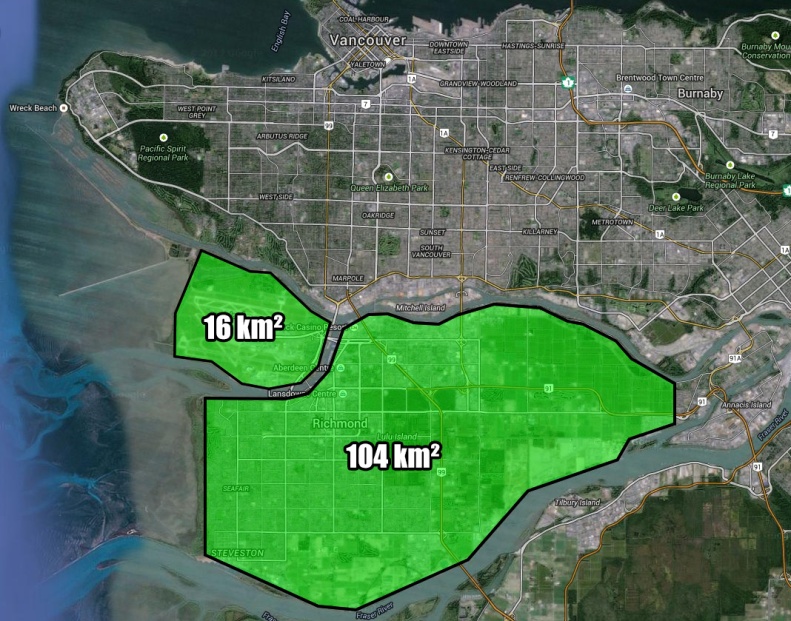
The high density development pattern would occupy the smaller area on Sea Island, while the low density development pattern would occupy all of the highlighted area. We will treat these areas as currently unoccupied.
For this analysis we will treat the low density population as exclusively automobile users and the high density population as exclusively transit users. We will assume a commuting pattern with 50% of residents making a trip to work/school during a 3 hour AM peak period and 50% making a trip home during a 3 hour PM peak period. This is equal to 180,000 people travelling during the peak periods or 60,000 hourly. While simplified, this captures the typical commute pattern of a residential suburb. We will also assume each morning trip crosses into Vancouver. Using these assumptions we can develop a rough estimate of the transportation costs associated with each form of development.
LOW DENSITY DEVELOPMENT PATTERN TRANSPORTATION COSTS
1) Freeways
With a freeway lane capacity of 2,000[2] vehicles per lane per hour we find that we would require 30 outbound lanes and 30 inbound lanes [3]. We will assume that these are provided by 10 lane freeways that each cost $2 billion to construct (including the interchanges and Fraser River crossings). That is equivalent to 60% of the cost of the Port Mann/Highway 1 project.[4]
Freeways required: 6 (at 10 lanes each)
Construction cost: $12.0 billion
2) Vehicles
We will assume a vehicle ownership rate of 75% which is equivalent to that of Delta, Maple Ridge, Pitt Meadows, and White Rock.[5] To calculate the total vehicle related expenditures over the time period we will use the average number of vehicles over the period (135,000) along with an $8,000 annual cost for vehicle ownership and operation as reported by the US Bureau of labor statistics.[6]
Additional vehicles: 270,000
Vehicle related expenditures: $10.8 billion
3) Parking
To determine the parking expenditures we will assume that half of the vehicles park in a garages at home that cost $10,000[7] to construct and the other half park in a driveways that costs $6,000[8] to construct. We will assume that each vehicle that travels to work/school during the peak period requires an underground parking space that costs $40,000[9][10] to construct. (This leads to a ratio of 1.7 new parking spaces per additional vehicle. This is far below the typical ratio found in cities, so this estimate is likely conservative.)[11]
Parking required at work/school locations: 180,000 spaces (5.4 km2)[12]
Construction cost of driveways, garages, and underground parking: $9.4 billion[13]

Parking area required for the 180,000 commuting vehicles
HIGH DENSITY DEVELOPMENT PATTERN TRANSPORTATION COSTS
1) Rapid Transit Lines
With a Skytrain capacity of 26,000[14] people per hour in each direction we find that the required capacity could be provided by 3 Skytrain lines. It should be noted that the Skytrain lines would be at 77% capacity while the proposed freeways would have no remaining capacity.[15] We will assume that each Skytrain line costs $2 billion to construct. This equivalent to the cost of the Canada Line project.[16]
Rapid transit lines required: 3
Construction cost: $6.0 billion
1) Transit Operations / Transit Passes
To calculate the expenditures on transit passes we will use the average number of people over the period (180,000) along with the current $124 price of a 2-zone transit pass.[17] We will assume the cost of the transit passes covers the operating costs of the rapid transit lines.
Transit operations cost: $2.7 billion
COST COMPARISON
| LOW DENSITY | HIGH DENSITY | |
| Freeways | $12.0 billion | – |
| Vehicles | $10.8 billion | – |
| Parking | $9.4 billion | – |
| Transit Lines | – | $6.0 billion |
| Transit Operations / Passes | – | $2.7 billion |
| TOTAL COSTS | $32.2 billion | $8.7 billion |
NOTES AND REFERENCES
1. Greater Vancouver Regional District Board (2013). Metro Vancouver 2040: Shaping Our Future. p. 68.
2. Rodrigue, J-P. (2013). The Geography of Transport Systems.
3. REQUIRED LANES (INBOUND) = 60,000 / 2,000 = 30
TOTAL REQUIRED LANES = 30 x 2 = 60
4. http://www.th.gov.bc.ca/tranprojectsbc/#view=details&id=123450000
5. ICBC (2013). Total Number of Registered Vehicles 1999-2013.
6. Smith, L. The True Cost of Owning A Car. Investopedia
7. Garaga. Planning, The Key to Building a Garage.
8. HomeAdvisor. How Much Does it Cost to Install a Driveway?
9. Smith, C. (2007, Sept 9). Parking Drives Up Costs. Straight.com
10. $40,000 per underground parking space is a rule of thumb used by Surrey’s transportation planning department
11. https://mtayloranalysis.wordpress.com/2014/10/02/growth-and-mobility-in-metro-vancouver-video/
12. REQUIRED PARKING AREA = NUMBER OF VEHICLES x AREA PER OFF STREET PARKING SPACE
180,000 X 30 m2 = 5.4 km2
13. PARKING CONSTRUCTION COST = 180,000 x $40,000 + 270,000 / 2 x $10,000 + 270,000 / 2 x $60,000
= $9,400,000,000
14. SNC-Lavalin (2010).Expo Line Upgrade Strategy. p. 22.
15. You could half the required capacity of both the rapid transit lines and freeways if the inbound and outbound directions were used equally in the AM and PM peaks. The point of this exercise is to compare the costs between two different patterns so this is not overly important for this analysis. It is worth noting that if we were to analyze this scenario we would find that a single Skytrain line could nearly provide the required capacity.
16. http://www.partnershipsbc.ca/projects/operational-complete/canada-line/
17. http://www.translink.ca/en/Fares-and-Passes/Monthly-Pass.aspx

Pingback: “Analysis”: The Next Ten Years | Price Tags
Not everyone likes high density. Urban politics needs to keep in mind that a range of housing options needs to be provided, from high end acreages to townhouses to high density micro lofts and everything in between.
We should price land and thus car use of it higher, far higher. The expectation that driving ( and parking ) is free on any road, besides your gasoline cost, needs to change. Then, and only then, will we find the required money to build more rapid transit. Look to Singapore, for example, where driving is very expensive and rapid transit is well built. That is what we need here in MetroVancouver, the rest is just a band aid, especially more buses.
We need more roads, bridge & tunnels AND more transit. It is not one or the other. Ports need roads, pipelines or rail .. for goods movement. People movement needs roads and transit, especially RAPID transit, not a socialist bus based system that is slower than a car, less convenient, more wobbly and not as flexible.
Take, for example, Lionsgate bridge. Built in the 1930’s .. with two lanes of traffic for a then tiny tiny Vancouver & W-Van. Never widened. It needs to be at minimum 5 lanes, perhaps 6 lanes PLUS a rail in the middle and a bike lane on it and a ped lane. Toll the car lanes. Then complete that rail link to downtown with a subway along Hastings (remember: viaducts will come out soon) to Second Narrows, looping back under Marine Drive. THAT would actually be used. Yes, that costs a lot of money – a few billion, but it would be a real game changer and worthy of enhanced taxation, as both car users and non-car users would benefit.
People do not mind paying for what is perceived of value, like a fast car lane or a RAPID train to downtown or airport. Buses are for the lower and low lower middle class and/or folks that do not value their time (students, seniors, disabled, unemployed, low wage earners). Trains and subways will be used by all. Buses will not. Roads must be tolled. Until that is understood by transit planners nothing much can get accomplished.
I don’t want to give the impression that I am saying everyone needs to live in ultra high density. It is just a hypothetical example to articulate a few points:
1) Metro Vancouver is growing at a very quick rate. That will take some combination of allowing relatively small (although still very substantial) areas to progress to very high densities, allowing considerable portions our cities to progress to medium density, or opening large tracts of new land up for new low density development.
2) A year of population growth in Metro Vancouver could use up the capacity on a new 6-lane freeway corridor. So if we plan to accommodate the new growth primarily on our road network, we will need a lot of expansion.
3) When people compare the costs of providing mobility through road vs. transit expansion they are often not doing a full accounting. Benefiting from the mobility provided by freeways requires having a vehicle to operate on it and having a parking space available on either end of the trip which somebody ultimately has to pay for. These costs are considerable and often ignored. If you could take a magic wand and have all the money spent on roads, vehicles, and parking in our region over 30 years, you could have a more expansive network of rapid transit that we could possibly use. Once again that is just a hypothetical thought to illustrate a point, but it is worth thinking about when considering spending priorities.